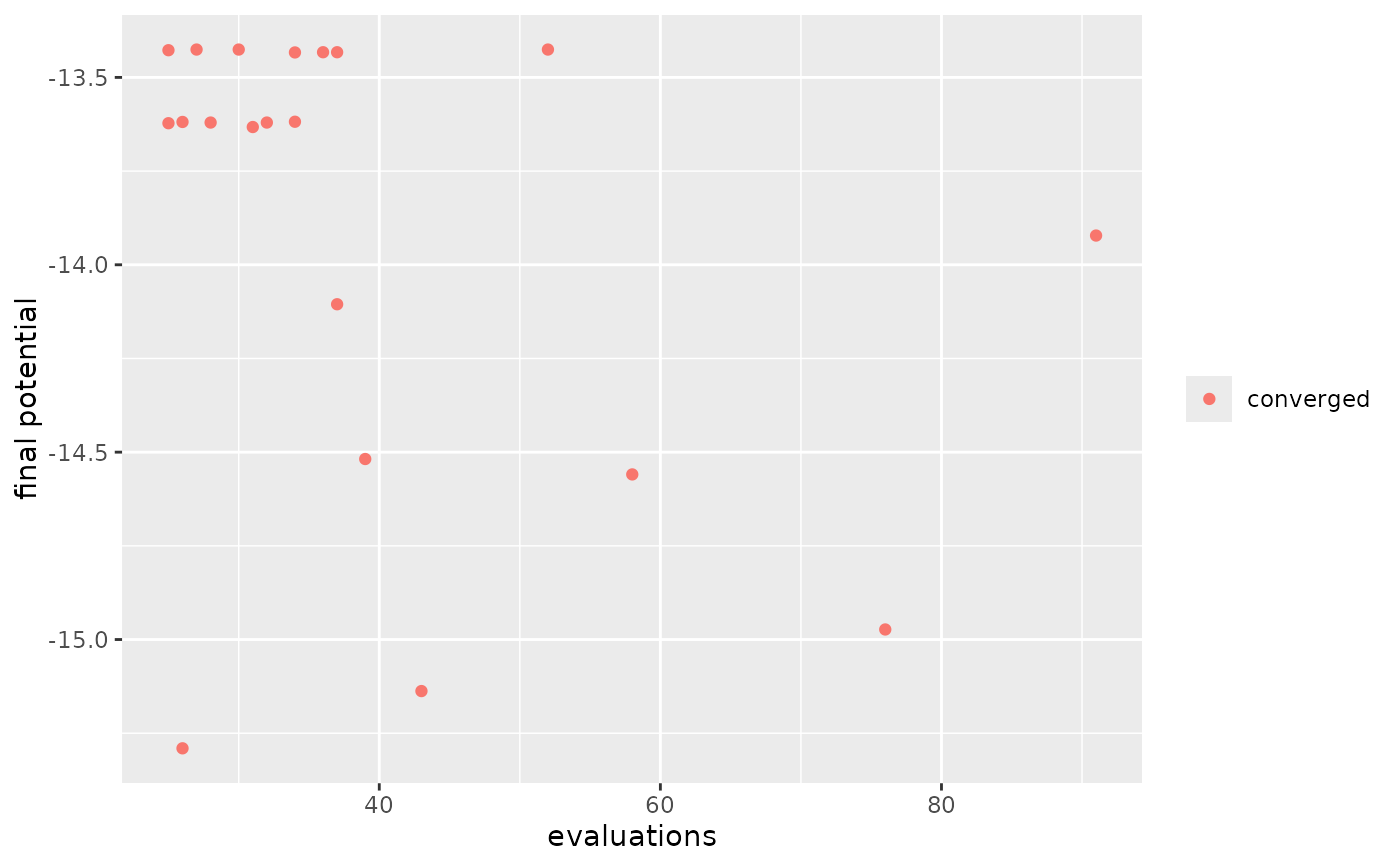
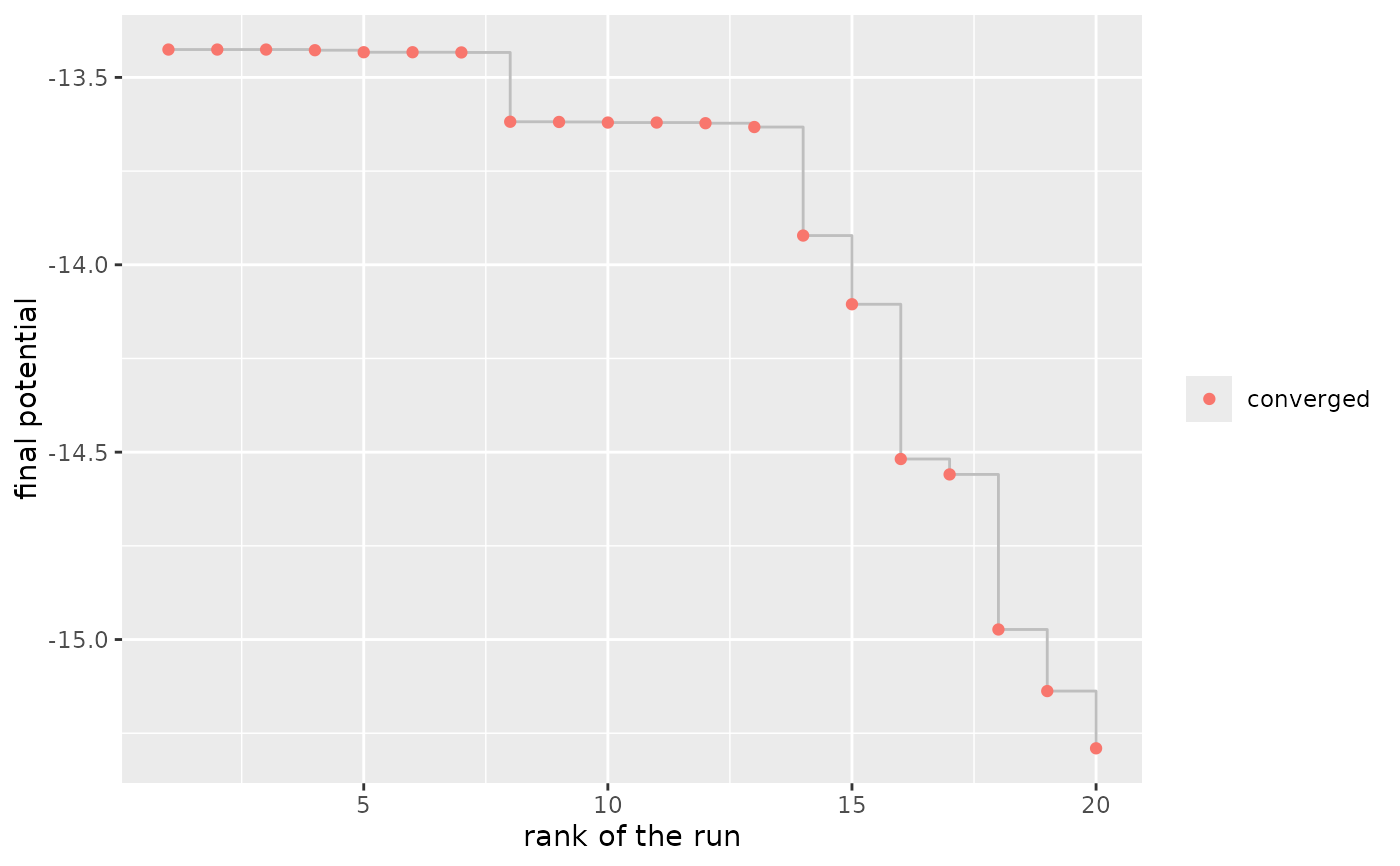
Displays the runs of blvim() described by sim_logs().
Arguments
- object
a data frame of class
blvim_logsproduced bysim_logs()- type
the type of graphical representation,
"staircase"or"scatter"- ...
additional parameters (not used currently)
Details
With type = "staircase" (default), the final potentials of the runs are
shown by decreasing value as a function of their rank. Each plateau
corresponds to a final configuration, and its width to the number of runs
that reach it.
With type = "scatter", the final potential of each run is shown as a
function of its number of evaluations (for the gradient algorithms) or
iterations (for the other algorithms).
In both cases, the colour gives the status of the run (see sim_logs()).
Examples
distances <- french_cities_distances[1:15, 1:15] / 1000
production <- rep(1, 15)
set.seed(1)
starts <- blvim_initialise(n = 20)
model <- blvim(distances, production, 1.5, 1 / 50, starts,
algorithm = "gradient", bipartite = FALSE
)
ggplot2::autoplot(sim_logs(model))
 ggplot2::autoplot(sim_logs(model), "scatter")